
In Why We Redesigned Our CDC Pipeline with Debezium and Flink, we introduced our Debezium + Flink-based CDC pipeline. Debezium captures database changes, routes them through Kafka, and Flink writes Parquet files to S3 every 5 minutes.

The pipeline worked well for over a year. Data consistency was verified, and operations were stable. The problem remained invisible until we dug into our S3 costs as part of a data platform TCO analysis.
S3 Cost Is More Than Just Data Scanned
If you run Athena, you probably think of cost like this:
“Athena cost = data scanned × $5/TB”
That’s not wrong — but it’s only the Athena service charge. Here’s what actually happens when Athena runs a query:
- Lists target files from S3 (LIST)
- Opens and reads each file (GET)
- Writes results back to S3 (PUT)
Among these, GET requests scale proportionally with the number of files. LIST operates at the prefix level, and PUT is once per query for result storage — but GET must open every single file. $0.0004 per 1,000 GET requests (ap-south-1) — sounds tiny, but not when you have hundreds of thousands of files.
We broke down our data platform’s S3 costs by API operation:
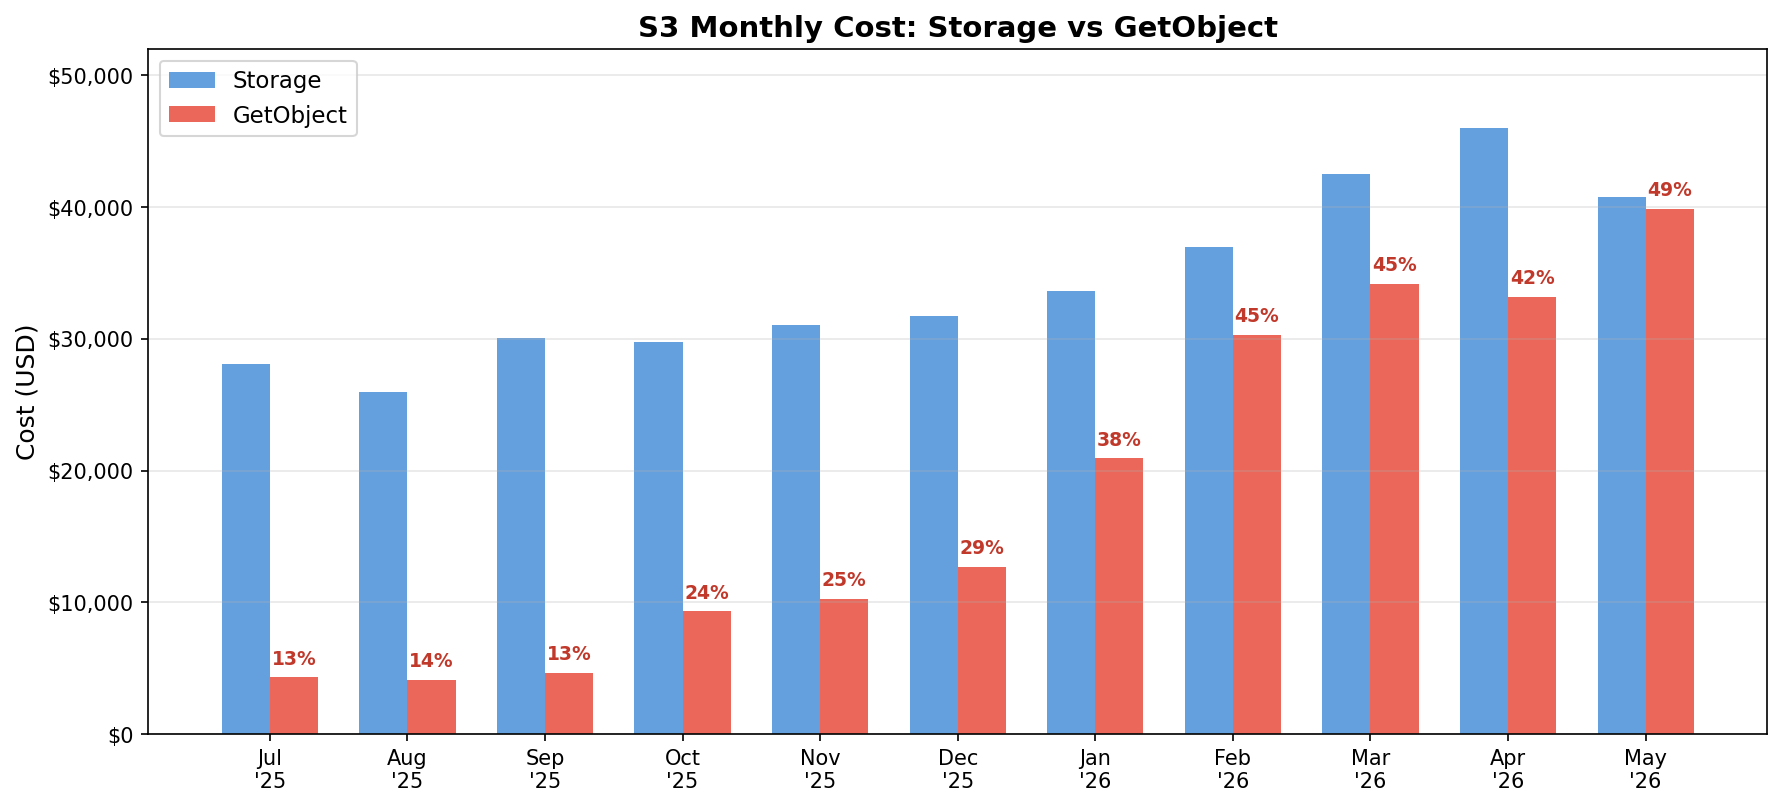
| Month | Storage | GetObject | Total | GET % |
|---|---|---|---|---|
| 2025-07 | $28,081 | $4,308 | $36,339 | 12% |
| 2025-08 | $25,986 | $4,149 | $34,475 | 12% |
| 2025-09 | $30,083 | $4,671 | $39,414 | 12% |
| 2025-10 | $29,782 | $9,320 | $43,508 | 21% |
| 2025-11 | $31,068 | $10,267 | $45,503 | 23% |
| 2025-12 | $31,729 | $12,683 | $48,121 | 26% |
| 2026-01 | $33,607 | $20,929 | $58,832 | 36% |
| 2026-02 | $36,960 | $30,292 | $72,107 | 42% |
| 2026-03 | $42,498 | $34,147 | $83,286 | 41% |
| 2026-04 | $46,006 | $33,171 | $86,619 | 38% |
| 2026-05 | $40,788 | $39,853 | $86,726 | 46% |
Over 10 months, storage grew 45%, but GetObject cost surged 825%. Nearly half of our S3 bill was from reading files.
Tracking Down the Culprit
To pinpoint the cost, we needed to know “which path’s files are being read how often.” The problem is that Cost Explorer only shows costs at the S3 service level — it can’t tell you which bucket or prefix is responsible.
We combined three approaches.
1. S3 Cost Allocation Tag + Cost Explorer
Tag your S3 buckets (e.g., purpose: datalake), then activate the tag in Billing → Cost Allocation Tags. Without activation, tags won’t appear in Cost Explorer filters. Once activated, group by tag to see storage vs request cost ratios per bucket.
2. S3 Storage Class Analysis
This feature analyzes access patterns per prefix within a bucket. The console provides limited visualization, but by configuring a destination bucket, you can export daily CSV data with GetRequestCount, DataRetrieved_MB, Storage_MB per prefix. Data appends daily, enabling trend analysis.
We set up analysis groups for 29 prefixes. Since multiple optimizations were running simultaneously, we used the stable window just before compaction (6/5~6/8 average) as our baseline:
Note: The GetRequestCount column actually includes both GET and PUT requests despite its name. AWS documentation explicitly states it is mislabelled. Keep this in mind for precise cost estimation.
| Prefix | Requests (M/day) | Daily Retrieval | Share |
|---|---|---|---|
| service_a.cdc | 718 | 117 TB | 92.7% |
| service_a.db | 14 | 12 TB | 1.9% |
| service_b.db | 9 | 7 TB | 1.2% |
| 26 other prefixes | 34 | 32 TB | 4.2% |
| Total | 775 | 168 TB |
A single prefix — service_a.cdc — accounted for 93% of all requests.
3. File-Level Analysis
While Storage Class Analysis showed us “where,” we needed to look at the actual file structure to understand “why.” We analyzed the CDC path on S3:
| Metric | Value |
|---|---|
| Total files (1 week) | 454,572 |
| Total size | 145 GB |
| Average file size | 335 KB |
| Files under 100KB | 79% |
335KB average. Clearly inefficient for Parquet files in production.
Why Small Files Happen
This is a structural problem in CDC pipelines.
Flink commits files at every checkpoint interval. Our setting is 5 minutes. That’s 288 times a day, across 300+ tables, each with dt partitions — multiply it out and you get tens of thousands of files per day.
Each file contains “changes that occurred in that table during those 5 minutes.” Most tables only see dozens to hundreds of changes per 5-minute window. The result: files ranging from a few KB to a few hundred KB pile up endlessly.
After about 14 months of operation, 31.4 million files had accumulated in the CDC path.
It’s Not Just About Cost
The small file problem isn’t limited to cost.
Reading from S3 requires opening an HTTP connection per file. Reading one 128MB file versus 400 files of 335KB each transfers roughly the same data, but the overhead differs by orders of magnitude.
- After listing files in a partition/prefix, each object must be opened individually
- Each file incurs GET or range GET, Parquet footer/metadata parsing, schema processing, and task scheduling overhead
- Without connection reuse, TCP handshake + TLS negotiation occurs for every file
Whether it’s Athena or Spark, no engine can be fast if it has to open hundreds of thousands of files.
How We Fixed It: Daily Compaction
We evaluated three approaches.
1. Increase Flink checkpoint interval
- Pros: Simplest approach
- Cons: Degrades data freshness, impacts all downstream — business monitoring, CDC-based replication, and other pipelines
2. Write directly to Iceberg from Flink
- Pros: Table format-level small file management
- Cons: Requires Flink sink redesign, high migration risk
3. Post-hoc Daily Compaction
- Pros: No changes to existing ingestion path, incremental rollout possible
- Cons: Additional batch cost, requires safety verification for file replacement
We chose option 3. It delivered the same result with the lowest risk, without touching the existing pipeline:
- Read all small files per partition (dt) and rewrite as 128MB files
- Preserve binlog position ordering
- Triggered daily by Airflow after CDC ingestion completes
Compaction replaces original files directly, so safeguards against data loss were essential. We implemented a Safe Swap pattern:
- Write compacted output to a temp path (
_tmp_compact/) - Verify files were successfully created in the temp path
- Delete originals → copy temp files to original location → delete temp
Even if a failure occurs mid-step-3, data remains in _tmp_compact/ for recovery. We also compare row counts before and after compaction to verify no data loss.
Since S3 doesn’t provide atomic rename/replace, we only target completed previous-day partitions — never active ones — and schedule execution during low-query windows.
Single partition test result: 72,885 → 839 files (99% reduction)
We also backfilled 520 days of historical data. 31.4 million files were reduced to 369,000 (98.8% reduction).
Results
| Metric | Before | After | Change |
|---|---|---|---|
| CDC file count | 31,400,000 | 369,000 | -98.8% |
| Average file size | 335 KB | varies by partition | |
| Compaction target size | - | 128 MB |
As compaction progressed, Requests/GB (requests per data retrieved) steadily decreased. This means the same amount of data could be read with fewer requests — the most direct measure of compaction effectiveness (Storage Class Analysis):
| Date | Requests | Data Retrieved | Requests/GB | Compaction Status |
|---|---|---|---|---|
| 6/5 | 749.1M | 124,013 GB | 6,041 | |
| 6/6 | 722.4M | 120,199 GB | 6,010 | |
| 6/7 | 724.0M | 120,407 GB | 6,013 | |
| 6/8 | 709.8M | 118,313 GB | 5,999 | Backfill started (66/520) |
| 6/9 | 596.5M | 104,129 GB | 5,729 | Backfill in progress (213/520) |
| 6/10 | 271.1M | 57,482 GB | 4,717 | Backfill in progress (427/520) |
| 6/11 | 34.1M | 19,708 GB | 1,731 | Backfill complete (520/520) |
| 6/12 | 22.4M | 17,296 GB | 1,298 | Stabilized |
| 6/13 | 22.4M | 17,515 GB | 1,282 | Stabilized |
| 6/14 | 21.9M | 17,325 GB | 1,264 | Stabilized |
The figures up to 6/11 still include PUT requests from the backfill. 6/12 is the first fully clean post-backfill day, and the numbers stabilized by 6/12~14 — Requests/GB dropped from 6,016 to 1,281, a 79% reduction in the number of requests needed to read the same amount of data.
Since daily data retrieval varies, we normalized to the same retrieval volume (100,000GB) to compare costs:
| Metric | Before (6/5~6/8 avg) | After (6/12~14 avg) | Change |
|---|---|---|---|
| Requests/GB | 6,016 | 1,281 | -79% |
| Requests per 100TB | 601.6M | 128.1M | -79% |
| Monthly request cost (est.) | ~$7,220/month | ~$1,537/month | -$5,683/month |
Cost calculation: requests × 30 days × $0.0004/1,000 (ap-south-1). Actual query volume may fluctuate, so these figures don’t map 1:1 to billing.
Daily compaction now runs automatically on the previous day’s partitions, preventing small files from accumulating again.
How Much Faster Is It?
To measure the performance impact beyond cost, we ran benchmarks. We restored pre-compaction original files (45,008) from S3 versioning to a separate bucket and compared them against post-compaction files (310) using identical Athena queries. Row counts matched exactly at 59,184,128.
-- Q1: Full COUNT (155 days)
SELECT count(*)
FROM loan
WHERE dt >= '2026-01-01' AND dt <= '2026-06-05'
→ Before: 4,542ms / After: 1,403ms (-69%)
-- Q2: Filtered COUNT
SELECT count(*)
FROM loan
WHERE dt >= '2026-01-01' AND dt <= '2026-06-05'
  AND status = 'CLOSED'
→ Before: 2,138ms / After: 1,041ms (-51%)
-- Q3: GROUP BY aggregation
SELECT status, count(*)
FROM loan
WHERE dt >= '2026-01-01' AND dt <= '2026-06-05'
GROUP BY status
ORDER BY 2 DESC
→ Before: 2,752ms / After: 1,243ms (-55%)
-- Q4: Single day COUNT
SELECT count(*)
FROM loan
WHERE dt = '2026-03-01'
→ Before: 826ms / After: 560ms (-32%)
| Query | Before (45,008 files) | After (310 files) | Improvement |
|---|---|---|---|
| Q1. COUNT(*) full | 4,542ms | 1,403ms | -69% |
| Q2. COUNT + filter | 2,138ms | 1,041ms | -51% |
| Q3. GROUP BY | 2,752ms | 1,243ms | -55% |
| Q4. Single day COUNT | 826ms | 560ms | -32% |
Across full scans, filtered queries, and aggregations, we observed 32–69% performance improvement. The total data scanned was identical — the difference comes purely from file-open overhead.
Looking Back
The common wisdom that “Athena cost = data scanned” actually delayed our discovery. Athena service charges looked like just a few hundred dollars per month — hardly alarming. But behind the scenes, hundreds of millions of S3 GET requests were firing daily, and those costs were buried in the S3 bill.
If you’re running a streaming pipeline that writes to S3, it’s worth checking:
- How much of your S3 cost is requests vs storage
- Whether requests are concentrated on specific prefixes (via Storage Class Analysis)
- What the average file size is in your streaming paths
If the answers are “requests exceed 40% of total S3 cost,” “requests concentrate on a single prefix,” and “average file size under 1MB” — you’re probably facing the same problem.
For more details on the CDC pipeline architecture, see the Afinit team blog.